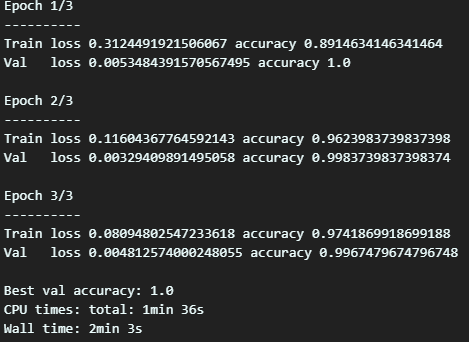
Continuing from the previous post(169_Image Classification using Torchvision(2)). %%timebase_model, history = train_model(base_model, data_loaders, dataset_sizes, device) To make the results easier to interpret, add a visualization function. def plot_training_history(history): fig, (ax1, ax2) = plt.subplots(1, 2, figsize=(18, 6)) ax1.plot(history['train_loss'], label='train loss') ax1.plot(h..